This page is supplementary to your results and explains some of the key indicators of your current health status.
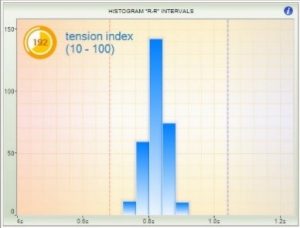
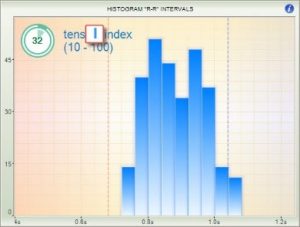
1. Stress Index: (Tension index) – How hard does the nervous system of the body have to work in order to achieve balance? 500 or over is a more critical issue. Lifestyle changes must be implemented.
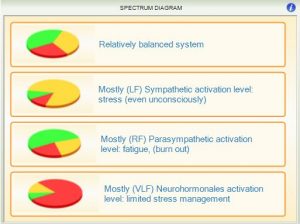
2. Vegetative Regulation – What you see on this screen is a circle with different colours. The yellow portion represents primarily the sympathetic nervous system and is labelled LF or low frequency. The green primarily represents the parasympathetic nervous system and is labelled HF for high frequency. Red is the Neurohormonal back up system and is labelled VLF or very low frequency. The VLF also has some sympathetic nervous system regulation properties. You can see the percentage of each of these regulatory systems that will tell you the predominance of one system in relationship to the other.
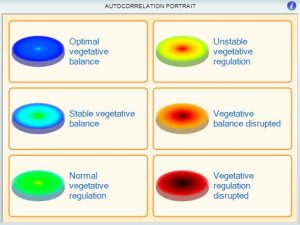
3. Autocorrelation Portrait – This has to do with the ability of the vessels of the body to contract and dilate as needed. A good example is if the body needs more blood supply, the vessels will need to dilate quickly such as when you do from sitting to running. Cardiovascular adaption is a good indication of orthostatic blood pressure and if the cardiovascular adaption is low, there is a good possibility that the blood pressure will do up if the sympathetic nervous system is dominant and the blood pressure can go low if the patient is in adrenal exhaustion. The point is that the blood pressure can be unstable if the cardiovascular adaption is low.
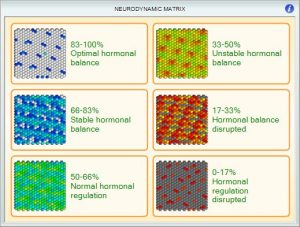
4. Hormonal Regulation Index – The normal range is between 50-100 and this represents how well chemical messengers or hormones can communicate at the right time. Think of 600 different systems highly coordinated like a symphony orchestra working seamlessly together.
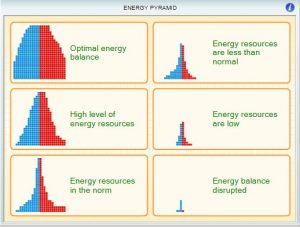
5. Metabolic energy resources (Energy pyramid) – Normal range is 150-600. You need to have adequate metabolic energy to do the work to manage body processes. All body functions require energy. If you have a score below 150, you are a person who performs work but needs a lot of recovery time.
What you really want is a metabolic energy of 200 or more. Athletes should be higher and this indicates good recovery time after performing work. If you autonomic nervous system the nervous system that controls more of your body’s functions) is working perfectly, your body will be more efficient and use less energy.
If your brain has to do most of the work to coordinate and produce hormones, this system is not as efficient as your autonomic nervous system and you will be less energy efficient. This will affect the power house of your cells call the mitochondria and drain your body of vital resources.
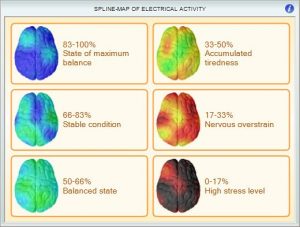
6. Psycho-emotional state index – The normal range is between 50-100 and is looking at the total power of the spectral density of the frequencies that regulate brain function such as Delta, Theta, Alpha and Beta. this is not an EEG of the brain but comes from a mathematical calculation rom the heart electrical cardiogram. This gives us an indication of overall brain function.
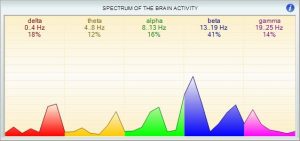
7. Spectrum of Brain Wave activity – When looking at the electrical activity of the brain we are looking at the output of neurons in the cortex of the brain generating electrical activity. this is not an actual EEG but is a mathematical algorhythm coming from the ECG of the heart to give us an approximation of brain activity. This analysis will break down this information into various frequencies that can tell us about different states of arousal. These are Delta, Alpha, Beta and Gamma (High Beta) waves.
Delta is related to sleep and brain stem functions. When high it can indicate white matter damage (brain injury) or sleep abnormalities. When it is abnormally higher than the other bands, it indicates an imbalance. You may feel sleepy, dreaming, detached, or depressed.
Theta is related to memory, emotion, and emotional brain (limbic system) functions where emotional memory is housed. Theta can be involved with being drowsy, deep relation, problem solving. Increased with catecholamine’s such as dopamine, epinephrine (adrenaline) and norepinephrine.
Alpha is related to the brain at rest or routine activities. Can indicate processing incapacities. this can be elevated in experienced meditators. Alpha is increased with relaxation, meditation, creative visualisation and increases serotonin.
Beta is related to activation and processing in the cortex of the brain. Beta increases when alert, concentrating, cognition, restlessness, stressed, anxiety. It can indicate over processing where the brain is ruminating. It can also show up anxiety.
High Beta shows up with excitement. Excitement related to learning, sporting events, concert etc. It can also relate to headaches and anxiety. on the valeo scan is shows up as Gamma, but it is in the High Beta frequency range.
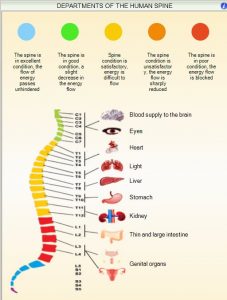
8. Department of the Human Spine – The ‘functional state of the spine’ tab displays information about the energy support of various departments of the spine and the activity of departments of the autonomic nervous system in different parts of the spine during testing. The screen displays areas of the spine in segments, the colour of which depends on the state of the energy flow and the activity of the relevant departments of the autonomic nervous system. the screen also indicates the relative values for each segment and the activity of the corresponding section of the autonomic nervous system.
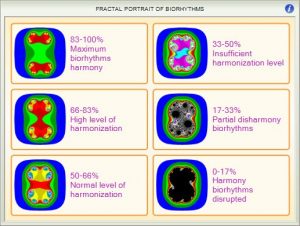
9. Fractal Analysis – Biorhythm Coherence – All systems of the body have the ability to adapt by going back and forth between active and resting states. This, for example, is seen in the electrical activity and rhythms of the heart and the brain; the breathing cycles of inspiration ad expiration; blood pressure changes between systolic and diastolic blood pressure; between sympathetic (flight/fight) ad parasympathetic (rest/digest). The key is that every physiologic process has its own unique rhythm and polarity and they all need to be oscillating in harmony with the whole body. Every physiologic process has its own unique rhythm, although they are also similar but have a different time scale. When examining one rhythm using a special mathematical system of fractal analysis from the heart rhythms, it is possible to draw conclusions about the structure and dynamics of other natural rhythms and how they are adapting in harmony with the whole body.
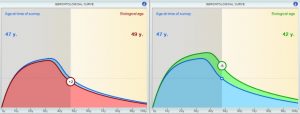
10. Gerontological Performance Curve – Scientists took a population of 10,000 health people of different ages with a variety of healthy conditions and plotted this information on a bell shaped curve according to their age and where optimum would be for that age. This graph will show what you actual age is compared to your biological age. We all want to be younger than our actual age. This is a clear indication of anti-aging.
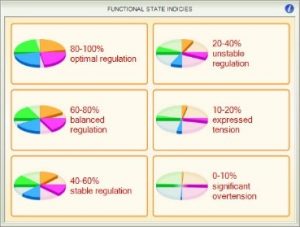
11. Functional State Index – How well is the body able to compensate under stress using all its regulatory resources. Stress of all kinds contributes to all health related issues. Peak performance is looking at 4 major regulatory systems and gives us a comprehensive score. The higher the score, the better the overall results.
A – Adaption Level (Cardiovascular)
B – Vegetative Regulation (Autonomic Nervous Sys)
C – Neurohormonal Regulation
D – Psycho-Emotional State
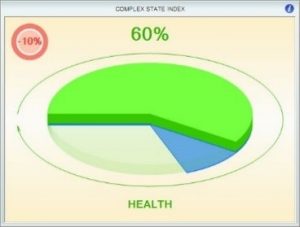
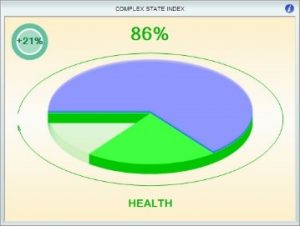
12. Complex State Index – This screen is the total score of A-B-C-D to give you a percentage of total health. You will have a small circle with a plus sign letting you know how much better that patient is over their age. This means their health capacity is good for their age. It will also tell us with a negative sign if their complex health parameters are worse than their age with a % as well.
The Valeo HRV – Main Features
- ECG recording with real-time monitoring of functional state indice
- Assessment of the state of cardiovascular and vegetative nervous system by means of variance analysis
- Assessment of body’s Neuro-hormonal regulation and energy resources by means of Neuro-dynamic analysis
- Assessment of current psycho-emotional state using the method of brain biorhythm mapping
- Assessment of organism adaption level and level of harmonization of biological rhythms using the method of fractal analysis
- Determination of patient’s biological age
- Simultaneous representation of two surveys’ results with a view of comparative analysis
- The software and the hardware of Dinamika meets the standards of measurement, physiological interpretation and clinical use of cardiac intervalometry indices, adopted by European Society of Cardiology and North American Association of Electrophysiology
- Production facilities if Dinamika meet the quality standards ISO 9001:2008
The VALEO HRV SCAN – Report of Findings is designed for research and education purposes and is not intended to diagnose or treat any disease.